AWS WAF Logs
WAF Access logs provide detailed information about traffic that is analyzed by your web ACL. Logged information includes the time that AWS WAF received a web request from your AWS resource, detailed information about the request, and details about the rules that the request matched.
You can create a log ingestion into Amazon OpenSearch Service or Light Engine either by using the Centralized Logging with OpenSearch console or by deploying a standalone CloudFormation stack.
Important
- You must deploy Centralized Logging with OpenSearch solution in the same region as your Web ACLs, or you will not be able to create a WAF pipeline.
For example:
- If your Web ACL is associated with Global Cloudfront, your must deploy the solution in us-east-1.
- If your Web ACL is associated with other resources in regions like Ohio, your Centralized Logging with OpenSearch stack must also be deployed in that region.
- The WAF logging bucket must be the same as the Centralized Logging with OpenSearch solution.
- WAF Classic logs are not supported in Centralized Logging with OpenSearch. Learn more about migrating rules from WAF Classic to the new AWS WAF.
- The Amazon OpenSearch Service index is rotated on a daily basis by default, and you can adjust the index in the Additional Settings.
Create log ingestion (OpenSearch Engine)
Using the Console
- Sign in to the Centralized Logging with OpenSearch Console.
- In the navigation pane, under Log Analytics Pipelines, choose Service Log.
- Choose the Create a log ingestion button.
- In the AWS Services section, choose AWS WAF.
- Choose Open Search, choose Next.
- Under Specify settings, choose Automatic or Manual.
- For Automatic mode, choose a Web ACL in the dropdown list.
- For Manual mode, enter the Web ACL name.
- (Optional) If you are ingesting WAF logs from another account, select a linked account from the Account dropdown list first.
- Specify an Ingest Options. Choose between Sampled Request or Full Request.
- For Sampled Request, enter how often you want to ingest sampled requests in minutes.
- For Full Request, if the Web ACL log is not enabled, choose Enable to enable the access log, or enter Log location in Manual mode. Note that Centralized Logging with OpenSearch will automatically enable logging with a Kinesis Data Firehose stream as destination for your WAF.
- Choose Next.
- In the Specify OpenSearch domain section, select an imported domain for Amazon OpenSearch domain.
- Choose Yes for Sample dashboard if you want to ingest an associated templated Amazon OpenSearch Service dashboard.
- You can change the Index Prefix of the target Amazon OpenSearch Service index if needed. The default prefix is the
Web ACL Name. - In the Log Lifecycle section, enter the number of days to manage the Amazon OpenSearch Service index lifecycle. The Centralized Logging with OpenSearch will create the associated Index State Management (ISM) policy automatically for this pipeline.
- In the Select log processor section, please choose the log processor.
- Choose Next.
- Add tags if needed.
- Choose Create.
Using the CloudFormation Stack
This automated AWS CloudFormation template deploys the Centralized Logging with OpenSearch - WAF Log Ingestion solution in the AWS Cloud.
| Launch in AWS Console | Download Template | |
|---|---|---|
| AWS Regions (Full Request) |  |
Template |
| AWS China Regions (Full Request) | |
Template |
| AWS Regions (Sampled Request) | |
Template |
| AWS China Regions (Sampled Request) | |
Template |
-
Log in to the AWS Management Console and select the button to launch the AWS CloudFormation template. You can also download the template as a starting point for your own implementation.
-
To launch the stack in a different AWS Region, use the Region selector in the console navigation bar.
-
On the Create stack page, verify that the correct template URL shows in the Amazon S3 URL text box and choose Next.
-
On the Specify stack details page, assign a name to your solution stack.
-
Under Parameters, review the parameters for the template and modify them as necessary. This solution uses the following parameters.
- Parameters for Full Request only
Parameter Default Description Log Bucket Name <Requires input>The S3 bucket name which stores the logs. Log Bucket Prefix <Requires input>The S3 bucket path prefix which stores the logs. - Parameters for Sampled Request only
Parameter Default Description WebACL Names <Requires input>The list of Web ACL names, delimited by comma. Interval 2The default interval (in minutes) to get sampled logs. The value must be greater or equal to 2, and less or equal to 180. - Common parameters
Parameter Default Description Log Source Account ID <Optional>The AWS Account ID of the S3 bucket. Required for cross-account log ingestion (Please add a member account first). By default, the Account ID you logged in at Step 1 will be used. Log Source Region <Optional>The AWS Region of the S3 bucket. By default, the Region you selected at Step 2 will be used. Log Source Account Assume Role <Optional>The IAM Role ARN used for cross-account log ingestion. Required for cross-account log ingestion (Please add a member account first). KMS-CMK ARN <Optional input>The KMS-CMK ARN for encryption. Leave it blank to create a new KMS CMK. Enable OpenSearch Ingestion as processor <Optional>Ingestion table Arn. Leave empty if you do not use OSI as Processor. S3 Backup Bucket <Requires input>The S3 backup bucket name to store the failed ingestion logs. Engine Type OpenSearch The engine type of the OpenSearch. Select OpenSearch or Elasticsearch. OpenSearch Domain Name <Requires input>The domain name of the Amazon OpenSearch cluster. OpenSearch Endpoint <Requires input>The OpenSearch endpoint URL. For example, vpc-your_opensearch_domain_name-xcvgw6uu2o6zafsiefxubwuohe.us-east-1.es.amazonaws.comIndex Prefix <Requires input>The common prefix of OpenSearch index for the log. The index name will be <Index Prefix>-<log-type>-<YYYY-MM-DD>.Create Sample Dashboard Yes Whether to create a sample OpenSearch dashboard. VPC ID <Requires input>Select a VPC which has access to the OpenSearch domain. The log processing Lambda will reside in the selected VPC. Subnet IDs <Requires input>Select at least two subnets which have access to the OpenSearch domain. The log processing Lambda will reside in the subnets. Make sure the subnets have access to the Amazon S3 service. Security Group ID <Requires input>Select a Security Group which will be associated with the log processing Lambda. Make sure the Security Group has access to the OpenSearch domain. Number Of Shards 5 Number of shards to distribute the index evenly across all data nodes. Keep the size of each shard between 10-50 GB. Number of Replicas 1 Number of replicas for OpenSearch Index. Each replica is a full copy of an index. If the OpenSearch option is set to Domain with standby, you need to configure it to 2. Age to Warm Storage 0 The number of days required to move the index into warm storage. This takes effect only when the value is larger than 0 and warm storage is enabled in OpenSearch. Age to Cold Storage 0 The number of days required to move the index into cold storage. This takes effect only when the value is larger than 0 and cold storage is enabled in OpenSearch. Age to Retain 0 The total number of days to retain the index. If value is 0, the index will not be deleted. Rollover Index Size <Optional>The minimum size of the shard storage required to roll over the index (e.g. 30GB). Index Suffix yyyy-MM-dd The common suffix format of OpenSearch index for the log(Example: yyyy-MM-dd, yyyy-MM-dd-HH). The index name will be <Index Prefix>-<Log Type>-<Index Suffix>-000001.Compression type best_compression The compression type to use to compress stored data. Available values are best_compression and default. Refresh Interval 1s How often the index should refresh, which publishes its most recent changes and makes them available for searching. Can be set to -1 to disable refreshing. Default is 1s. Plugins <Optional>List of plugins delimited by comma. Leave it blank if there are no available plugins to use. Valid inputs are user_agent,geo_ip.EnableS3Notification True An option to enable or disable notifications for Amazon S3 buckets. The default option is recommended for most cases. LogProcessorRoleName <Optional>Specify a role name for the log processor. The name should NOT duplicate an existing role name. If no name is specified, a random name is generated. QueueName <Optional>Specify a queue name for an SQS. The name should NOT duplicate an existing queue name. If no name is given, a random name will be generated. -
Choose Next.
-
On the Configure stack options page, choose Next.
-
On the Review page, review and confirm the settings. Check the box acknowledging that the template creates AWS Identity and Access Management (IAM) resources.
-
Choose Create stack to deploy the stack.
You can view the status of the stack in the AWS CloudFormation console in the Status column. You should receive a CREATE_COMPLETE status in approximately 10 minutes.
View dashboard
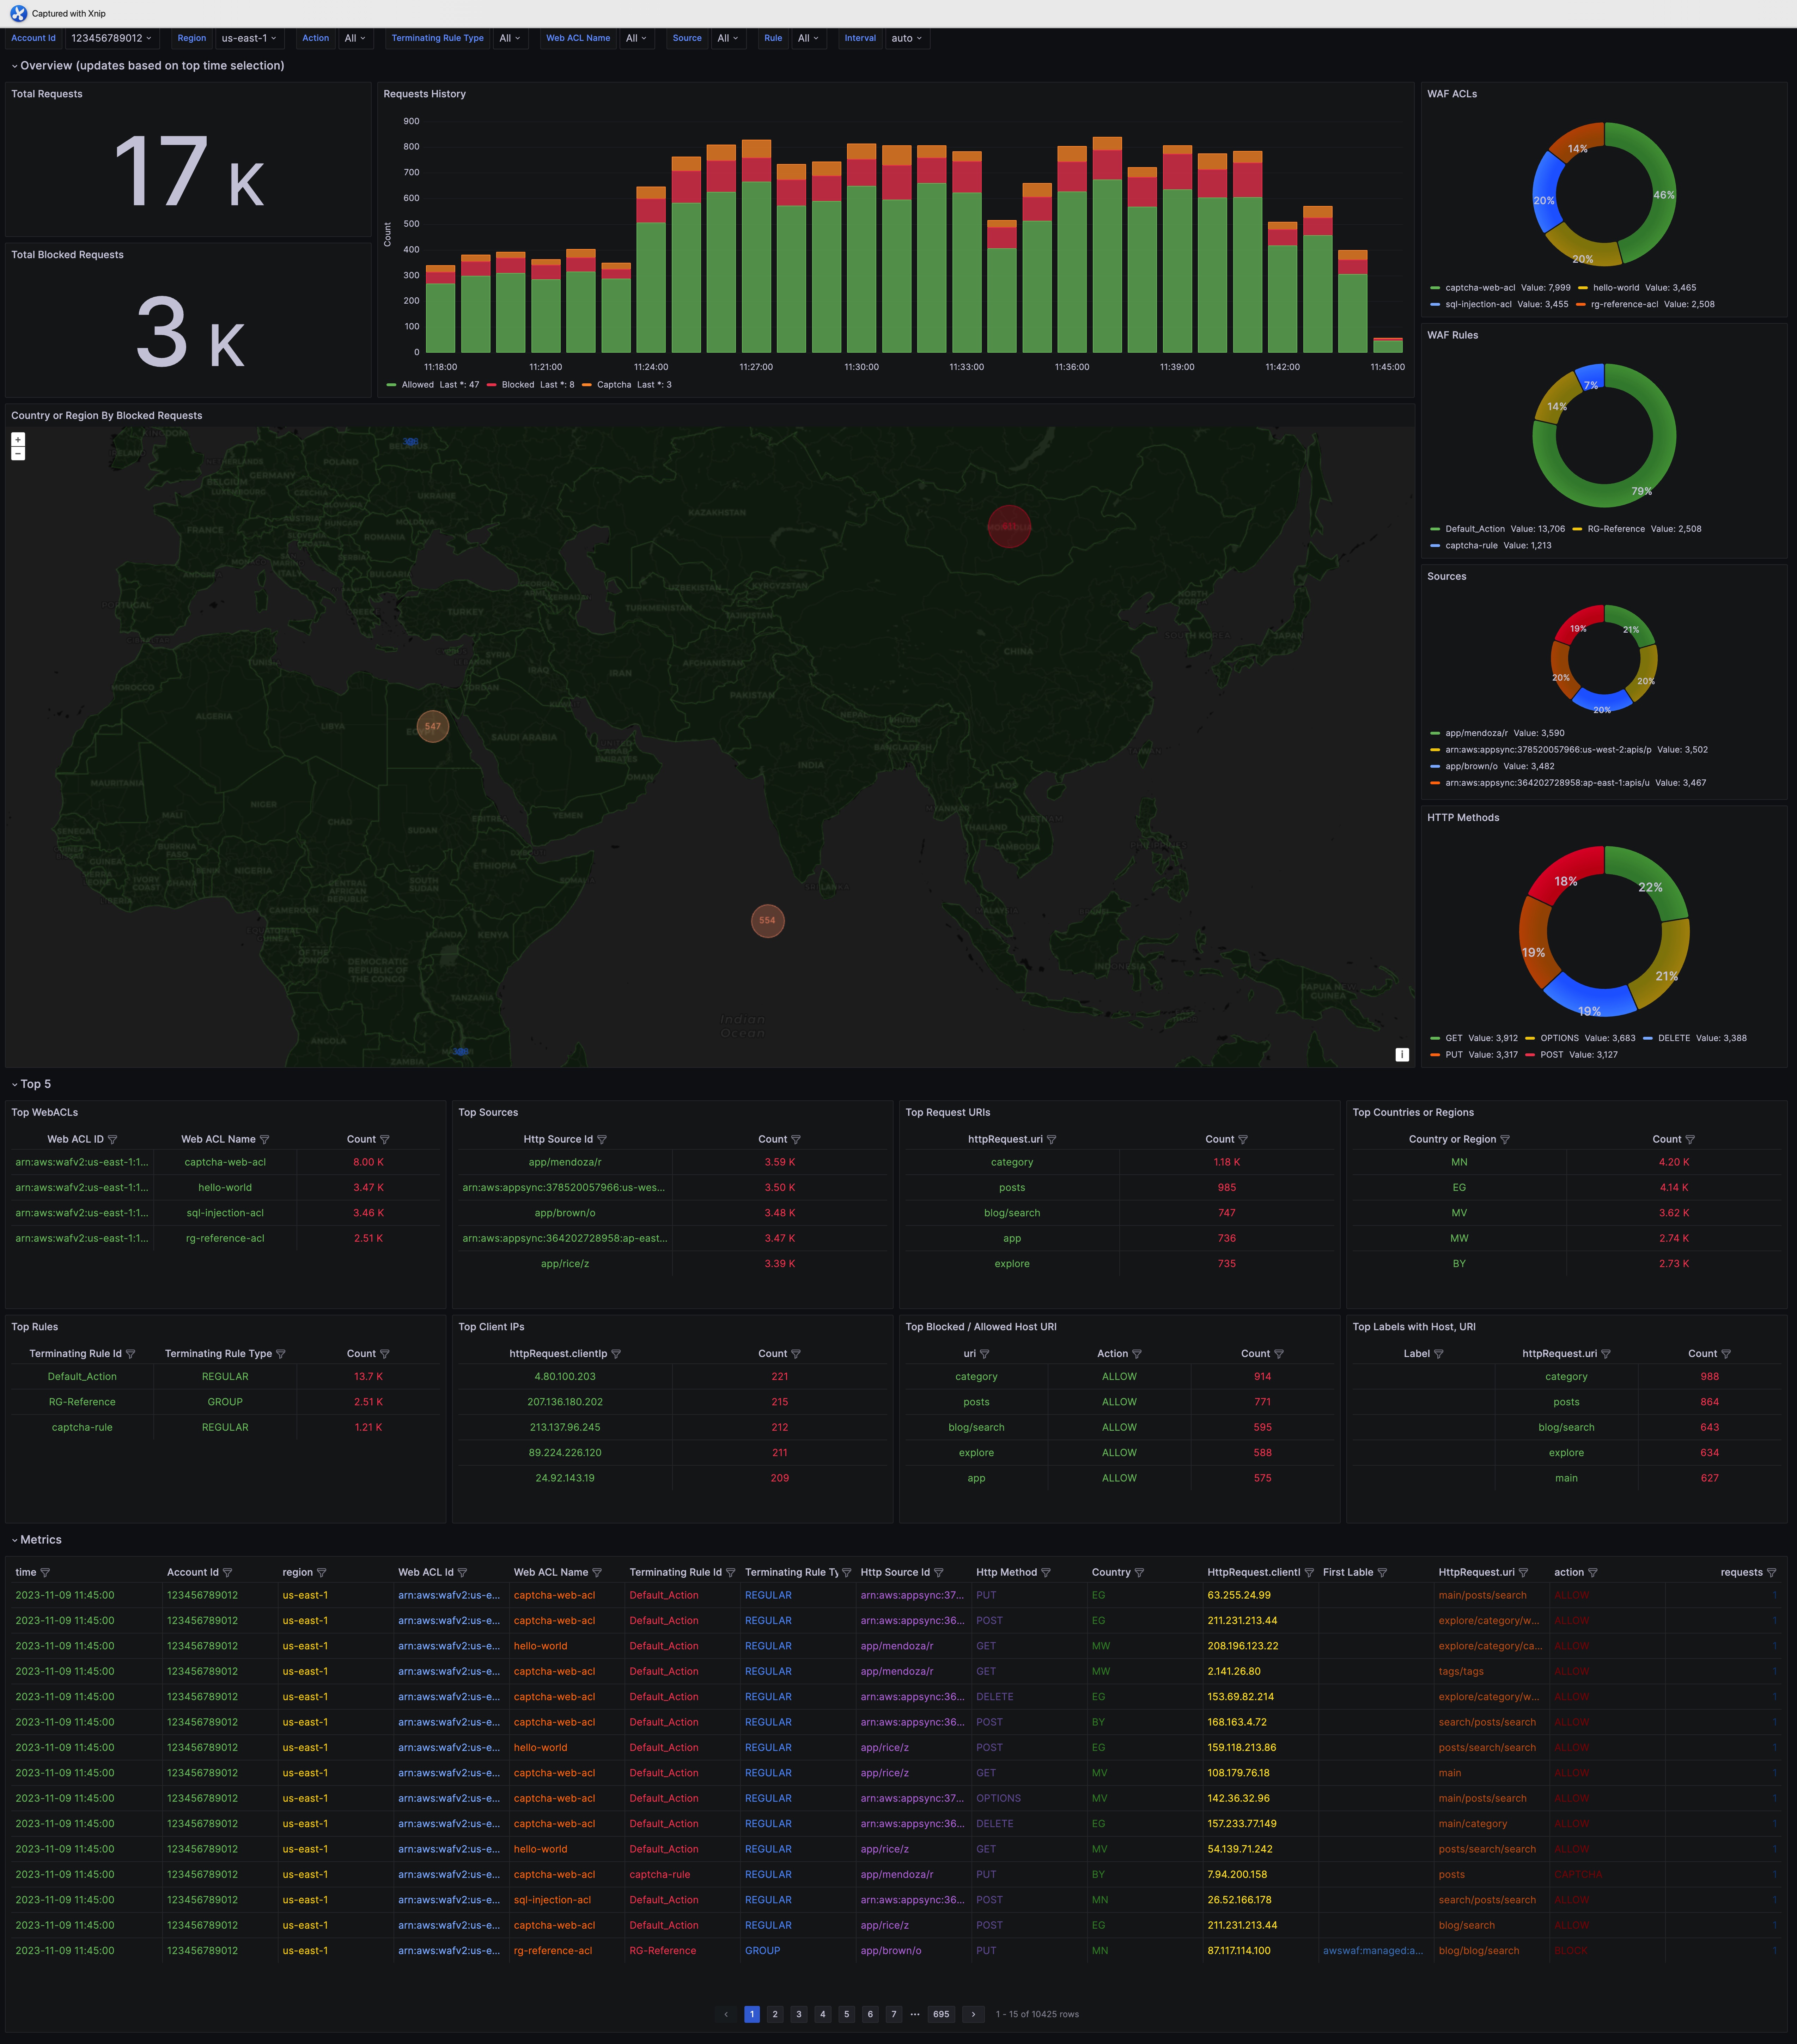
The dashboard includes the following visualizations.
| Visualization Name | Source Field | Description |
|---|---|---|
| Filters |
|
The following data can be filtered by query filter conditions. |
| Web ACLs |
|
Displays the count of requests made to the WAF, grouped by Web ACL Names. |
| Total Requests |
|
Displays the total number of web requests. |
| Requests History |
|
Presents a bar chart that displays the distribution of events over time. |
| WAF Rules |
|
Presents a pie chart that displays the distribution of events over the WAF rules in the Web ACL. |
| Total Blocked Requests |
|
Displays the total number of blocked web requests. |
| Unique Client IPs |
|
Displays unique visitors identified by client IP. |
| Country or Region By Request |
|
Displays the count of requests made to the Web ACL (grouped by the corresponding country or region resolved by the client IP). |
| HTTP Methods |
|
Displays the count of requests made to the Web ACL using a pie chart, grouped by http request method names (e.g., POST, GET, HEAD, etc.). |
| HTTP Version |
|
Displays the count of requests made to the Web ACL using a pie chart, grouped by http protocol version (e.g., HTTP/2.0, HTTP/1.1, etc.). |
| Top WebACLs |
|
The web requests view enables you to analyze the top web requests. |
| Top Hosts |
|
Lists the source IP addresses associated with events, enabling you to identify and investigate potentially suspicious or unauthorized activities. |
| Top Request URIs |
|
Top 10 request URIs. |
| Top Countries or Regions |
|
Top 10 countries with the Web ACL Access. |
| Top Rules |
|
Top 10 rules in the web ACL that matched the request. |
| Top Client IPs |
|
Provides the top 10 IP address. |
| Top User Agents |
|
Provides the top 10 user agents |
| Block Allow Host Uri |
|
Provides blocked or allowed web requests. |
| Top Labels with Host, Uri |
|
Top 10 detailed logs by labels with host, URI |
| View by Matching Rule |
|
This visualization provides detailed logs by DQL "terminatingRuleId:*". |
| View by httpRequest args,uri,path |
|
This visualization provides detailed logs by DQL. |
Sample Dashboard
You can access the built-in dashboard in Amazon OpenSearch to view log data. For more information, see Access Dashboard.
You can click the below image to view the high-resolution sample dashboard.
Create log ingestion (Light Engine)
Using the Console
- Sign in to the Centralized Logging with OpenSearch Console.
- In the navigation pane, under Log Analytics Pipelines, choose Service Log.
- Choose the Create a log ingestion button.
- In the AWS Services section, choose AWS WAF.
- Choose Light Engine, choose Next.
- Under the Specified Settings, select Automatic or Manual.
- For the Automatic mode, choose a Web ACL from the dropdown list.
- For the Manual mode, enter the Web ACL name.
- (Optional) If you need to ingest logs across AWS accounts, select a linked AWS account from the account dropdown list.
- In the Ingestion Options section, select Full Request.
- For Full Request, if Web ACL logging is not enabled, click Enable Access Logging to enable access logs. Alternatively, enter the log location in manual mode. Note that using the log delivery stream will automatically enable using Kinesis Data Firehose as the target for WAF logs.
- Select Next.
- In the Specify Light Engine Configuration section, if you want to ingest associated templated Grafana dashboards, select Yes for the sample dashboard.
- You can choose an existing Grafana, or if you need to import a new one, you can go to Grafana for configuration.
- Select an S3 bucket to store partitioned logs and define a name for the log table. We have provided a predefined table name, but you can modify it according to your business needs.
- The log processing frequency is set to 5 minutes by default, with a minimum processing frequency of 1 minute.
- In the Log Lifecycle section, enter the log merge time and log archive time. We have provided default values, but you can adjust them based on your business requirements.
- Select Next.
- If desired, add tags.
- Select Create.
Using the CloudFormation Stack
This automated AWS CloudFormation template deploys the Centralized Logging with OpenSearch - WAF Log Ingestion solution in the AWS Cloud.
| Launch in AWS Console | Download Template | |
|---|---|---|
| AWS Region(Full Request) | |
Template |
| AWS China Regions (Full Request) | |
Template |
-
Log in to the AWS Management Console and select the button to launch the AWS CloudFormation template. You can also download the template as a starting point for your own implementation.
-
To launch the stack in a different AWS Region, use the Region selector in the console navigation bar.
-
On the Create stack page, verify that the correct template URL shows in the Amazon S3 URL text box and choose Next.
-
On the Specify stack details page, assign a name to your solution stack.
-
Under Parameters, review the parameters for the template and modify them as necessary. This solution uses the following parameters.
- Parameters for Pipeline settings
Parameter Default Description Pipeline Id <<需要输入>input>The unique identifier for the pipeline is essential if you need to create multiple WAF pipelines and write different WAF logs into separate tables. To ensure uniqueness, you can generate a unique pipeline identifier using uuidgenerator. Staging Bucket Prefix AWSLogs/WAFLogs The storage directory for logs in the temporary storage area should ensure the uniqueness and non-overlapping of the Prefix for different pipelines. - Parameters for Destination settings
Parameters Default Description Centralized Bucket Name <Requires input>Input centralized s3 bucket name,for expample:centralized-logging-bucket。 Centralized Bucket Prefix datalake Input centralized bucket prefix,default is datalake which means your data base's location is s3://{Centralized Bucket Name}/{Centralized Bucket Prefix}/amazon_cl_centralized。 Centralized Table Name WAF Table name for writing data to the centralized database, can be defined as needed, default value is 'waf'. - Parameters for Scheduler settings
Parameters Default Description LogProcessor Schedule Expression rate(5 minutes) Task scheduling expression for performing log processing, with a default value of executing the LogProcessor every 5 minutes. Configuration for reference。 LogMerger Schedule Expression cron(0 1 * ? ) 执ask scheduling expression for performing log merging, with a default value of executing the LogMerger at 1 AM every day. Configuration for reference。 LogArchive Schedule Expression cron(0 2 * ? ) Task scheduling expression for performing log archiving, with a default value of executing the LogArchive at 2 AM every day. Configuration for reference。 Age to Merge 7 Small file retention days, with a default value of 7, indicates that logs older than 7 days will be merged into small files. It can be adjusted as needed. Age to Archive 30 Log retention days, with a default value of 30, indicates that data older than 30 days will be archived and deleted. It can be adjusted as needed. - Parameters for Notification settings
Parameters Default Description Notification Service SNS Notification method for alerts. If your main stack is using China, you can only choose the SNS method. If your main stack is using Global, you can choose either the SNS or SES method. Recipients <Requires Input>Alert notification: If the Notification Service is SNS, enter the SNS Topic ARN here, ensuring that you have the necessary permissions. If the Notification Service is SES, enter the email addresses separated by commas here, ensuring that the email addresses are already Verified Identities in SES. The adminEmail provided during the creation of the main stack will receive a verification email by default. - Parameters for Dashboard settings
Parameters Default Description Import Dashboards FALSE Whether to import the Dashboard into Grafana, with a default value of false. If set to true, you must provide the Grafana URL and Grafana Service Account Token.。 Grafana URL <Requires Input>Grafana access URL,for example: https://alb-72277319.us-west-2.elb.amazonaws.com。 Grafana Service Account Token <Requires Input>Grafana Service Account Token:Service Account Token created in Grafana。 -
Choose Next.
-
On the Configure stack options page, choose Next.
-
On the Review page, review and confirm the settings. Check the box acknowledging that the template creates AWS Identity and Access Management (IAM) resources.
-
Choose Create stack to deploy the stack.
You can view the status of the stack in the AWS CloudFormation console in the Status column. You should receive a CREATE_COMPLETE status in approximately 10 minutes.
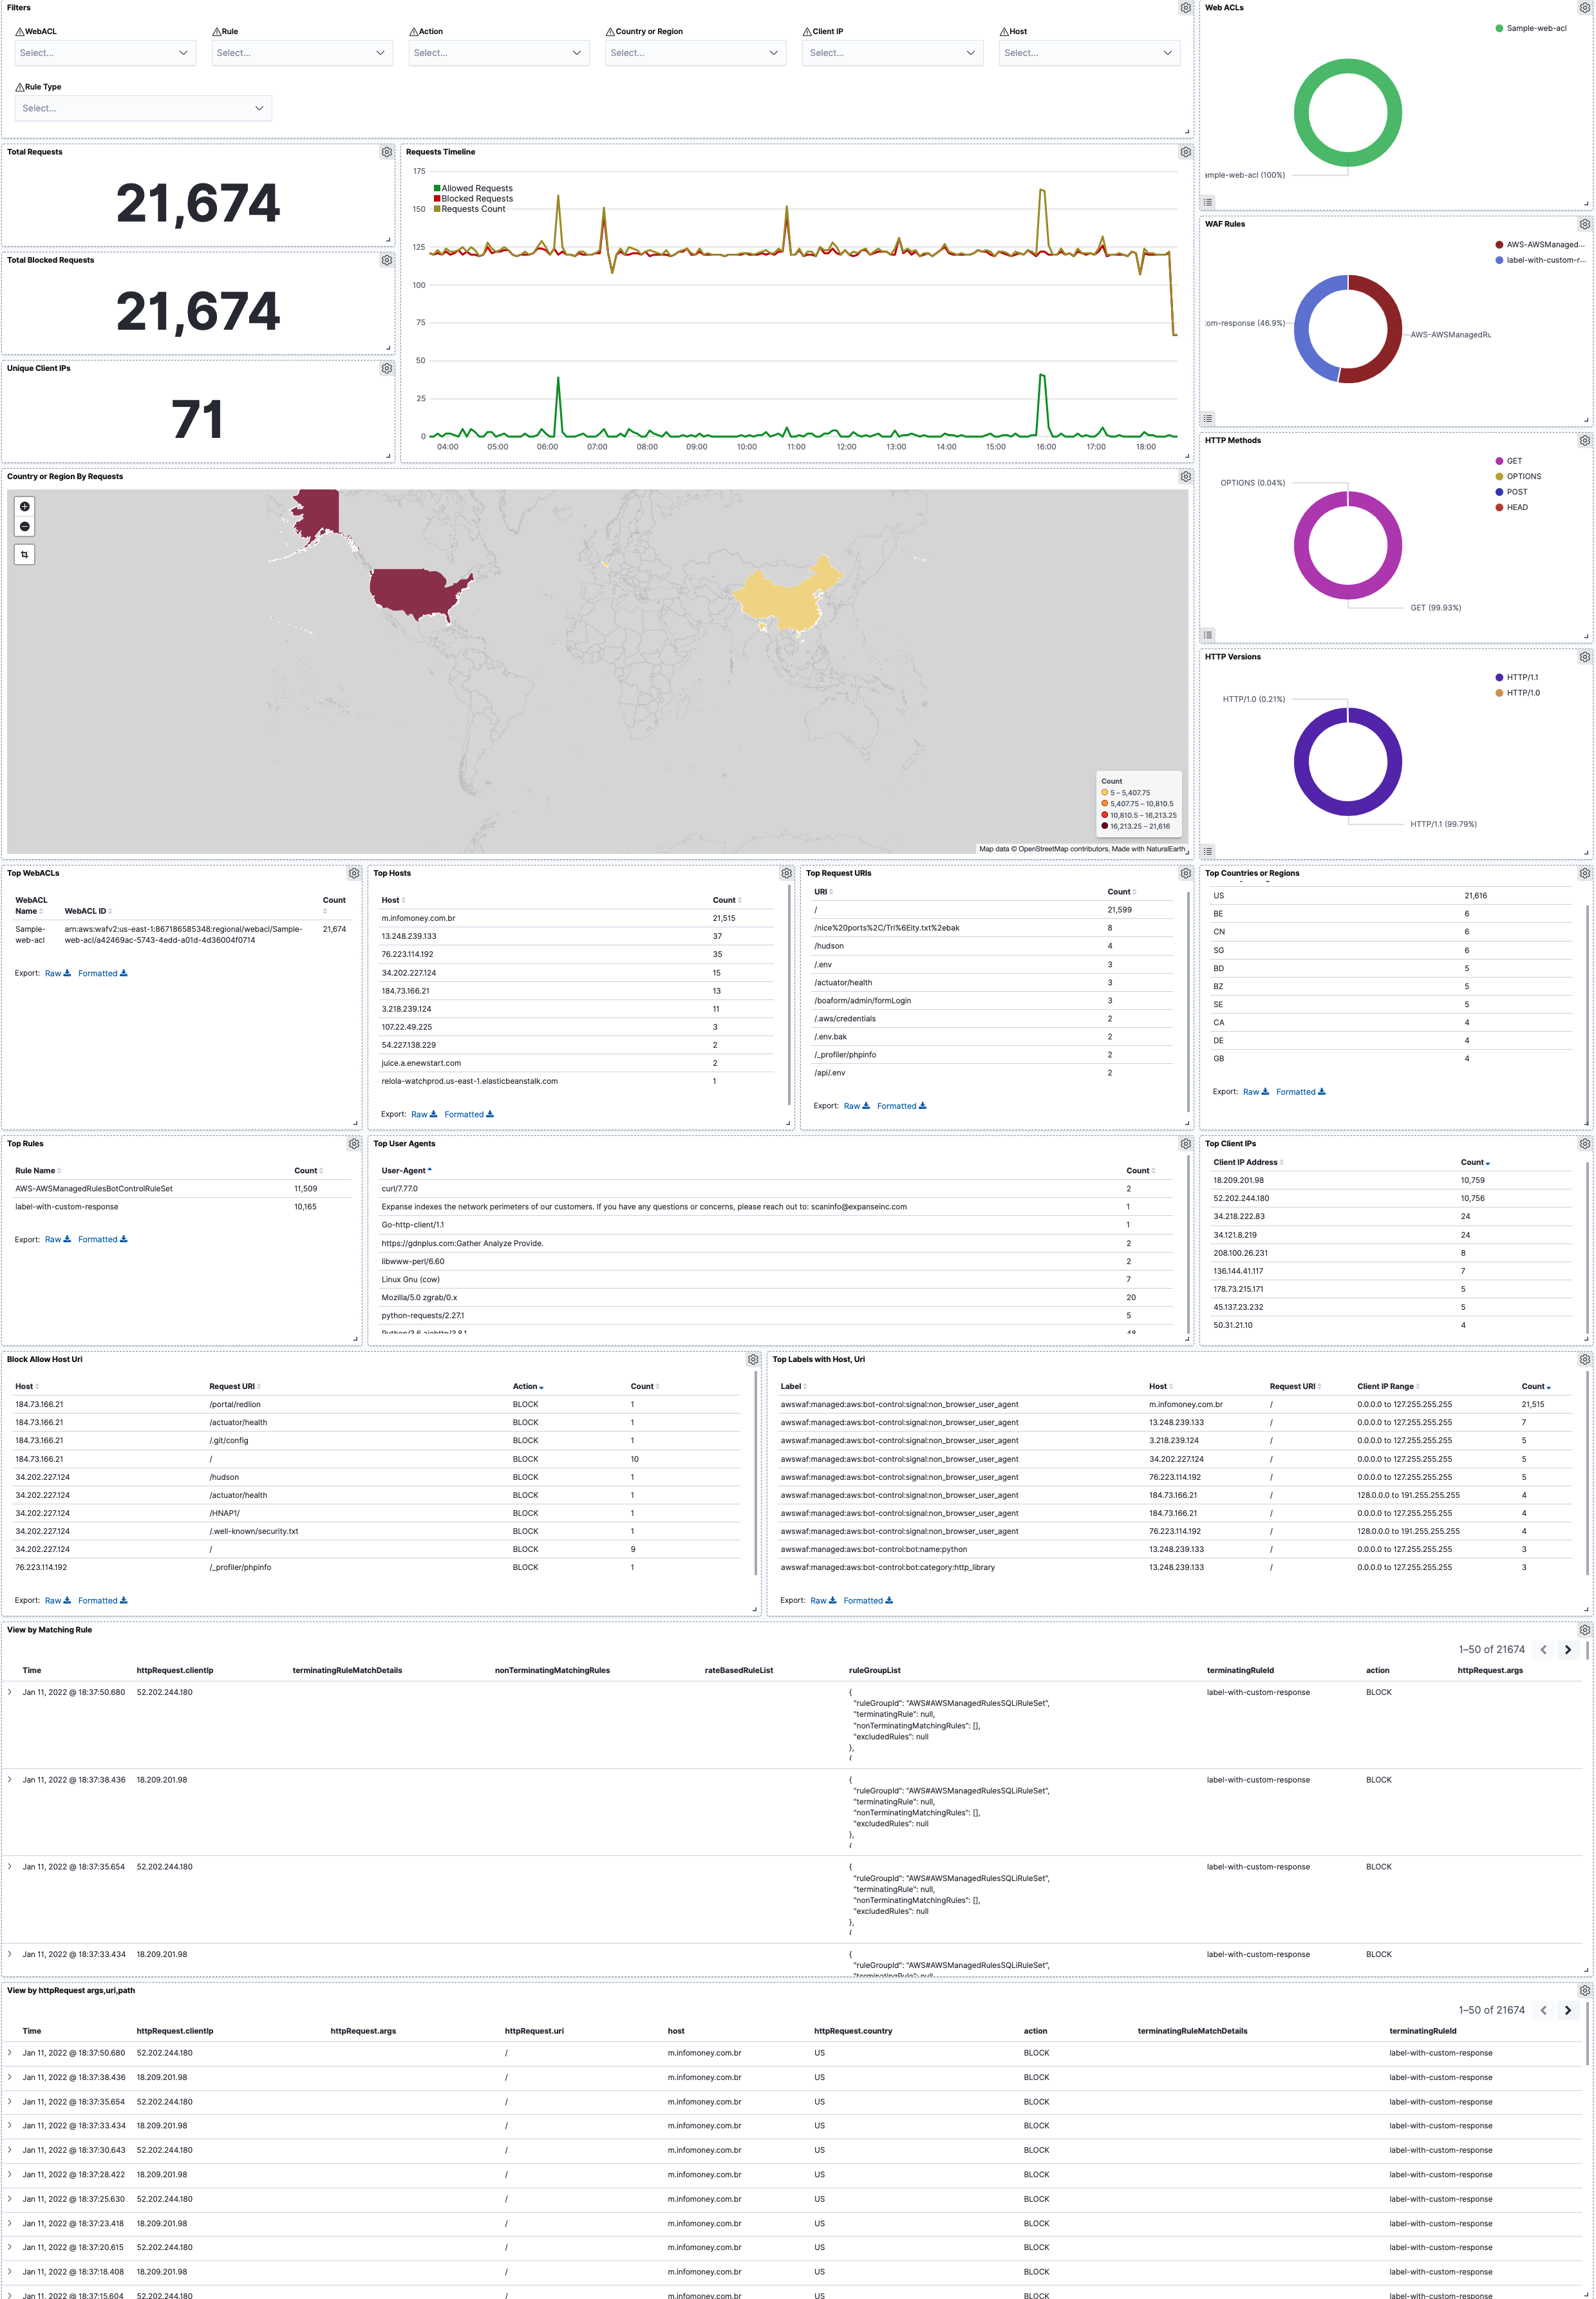
View Dashboard
| Visualization Name | Source Field | Description |
|---|---|---|
| Filters | Filters | The following data can be filtered by query filter conditions. |
| Total Requests | log event | Displays the total number of web requests. |
| Allow | log event | Displays the total number of allowed web requests. |
| Block | log event | Displays the total number of blocked web requests. |
| Unique Visitors | log event | Displays unique visitors identified by client IP. |
| Requests History | log event | Presents a bar chart that displays the distribution of events over time. |
| WAF ACLs | log event webaclName | Displays the count of requests made to the WAF, grouped by Web ACL Names. |
| WAF Rules | terminatingRuleId | Presents a pie chart that displays the distribution of events over the WAF rules in the Web ACL. |
| Sources | httpSourceId | Presents a pie chart that displays the distribution of events over the id of the associated resource. |
| HTTP Methods | httpRequest.HTTPMethod | Displays the count of requests made to the Web ACL using a pie chart, grouped by HTTP request method names (e.g., POST, GET, HEAD, etc.). |
| Country or Region By Requests | HTTPRequest.Country | Displays the count of blocked web requests made to the Web ACL (grouped by the corresponding country or region resolved by the client IP). |
| Top 10 Host | host | Lists the source IP addresses associated with events, enabling you to identify and investigate potentially suspicious or unauthorized activities. |
| Top 100 Request URIs | httpRequest.URI | Top 100 request URIs. |
| Top 5 Countries or Regions | httpRequest.country | Top 5 countries with the Web ACL Access. |
| Top 100 Terminating Rules | terminatingRuleId | Top 100 rules in the web ACL that matched the request. |
| Top 100 Non-Terminating Rules | nonterminatingRuleId | Top 100 rules in the web ACL that matched the request. |
| Top 100 Client IPs | httpRequest.ClientIP | Provides the top 100 IP addresses. |
| Top 100 Labels | labels host httpRequest.URI | Top 100 detailed logs by labels with host, URI. |
| View by Rule (The Latest 500 Items) | webaclId webaclName terminatingRuleId terminatingRuleType httpSourceId httpRequest.HTTPMethod httpRequest.country httpRequest.ClientIP labels httpRequest.URI action | Provides a detailed list of log events, including timestamps, WebACL, client IP, etc. |
Sample dashboard